Plot illustrations about extrapolation in illustration style.
Source:R/plotting.R
illustrate_extrapolation.Rdillustrate_extrapolation plots elements of extrapolations
(e.g., marked points, reference lines) in the same style as
illustrate_signal.
illustrate_extrapolation(
  df,
  dynamic_range,
  title = NULL,
  show_neighbors = TRUE,
  show_extrapolated_points_and_lines = TRUE,
  ...
)
Arguments
- df
data.frame.The original data before extrapolation.
- dynamic_range
numerical vector. The dynamic ranges of the input signal. Should be a 2-element numerical vector.
c(low, high), wherelowis the negative max value the device can reach andhighis the positive max value the device can reach.- title
Char. The title of the plot.
- show_neighbors
bool. Show the points used for extrapolation if TRUE.
- show_extrapolated_points_and_lines
bool. Show the extrapolated points and curves used for extrapolation.
- ...
Parameters that can be used to tune extrapolation, including
spar,k, andnoise_level. Seeextrapolatefor explanations.
Value
ggplot2 graph object. The graph to be shown.
See also
Other visualization functions.:
generate_interactive_plot(),
illustrate_signal()
Examples
# Use the maxed-out data for the conceptual diagram
df = conceptual_diagram_data[
conceptual_diagram_data['GRANGE'] == 2,
c("HEADER_TIME_STAMP", "X")]
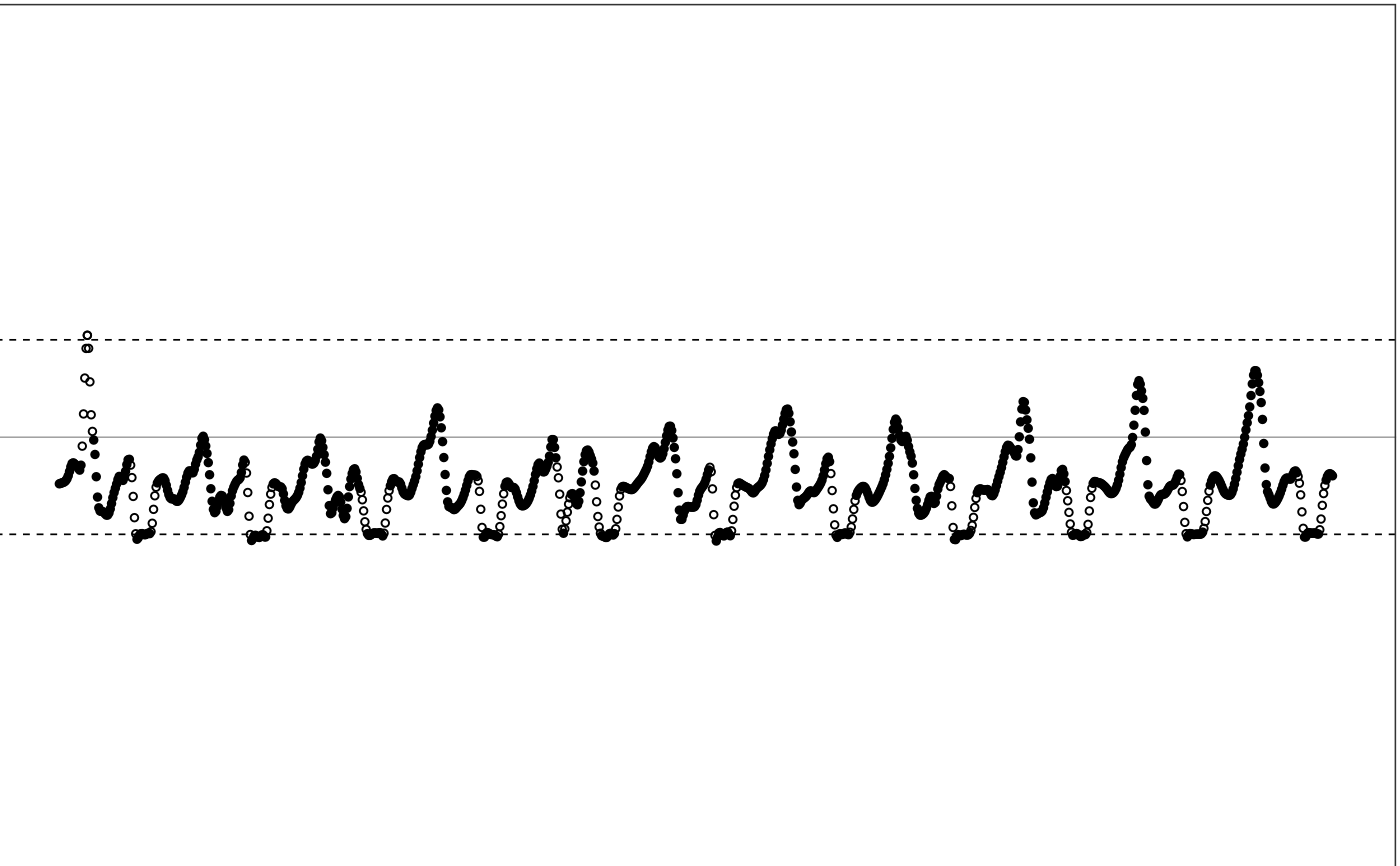
# Plot extrapolation illustration using default settings
illustrate_extrapolation(df, dynamic_range=c(-2,2))
#> Warning: collapsing to unique 'x' values
#> Warning: A <numeric> value was passed to a Datetime scale.
#> ℹ The value was converted to a <POSIXct> object.
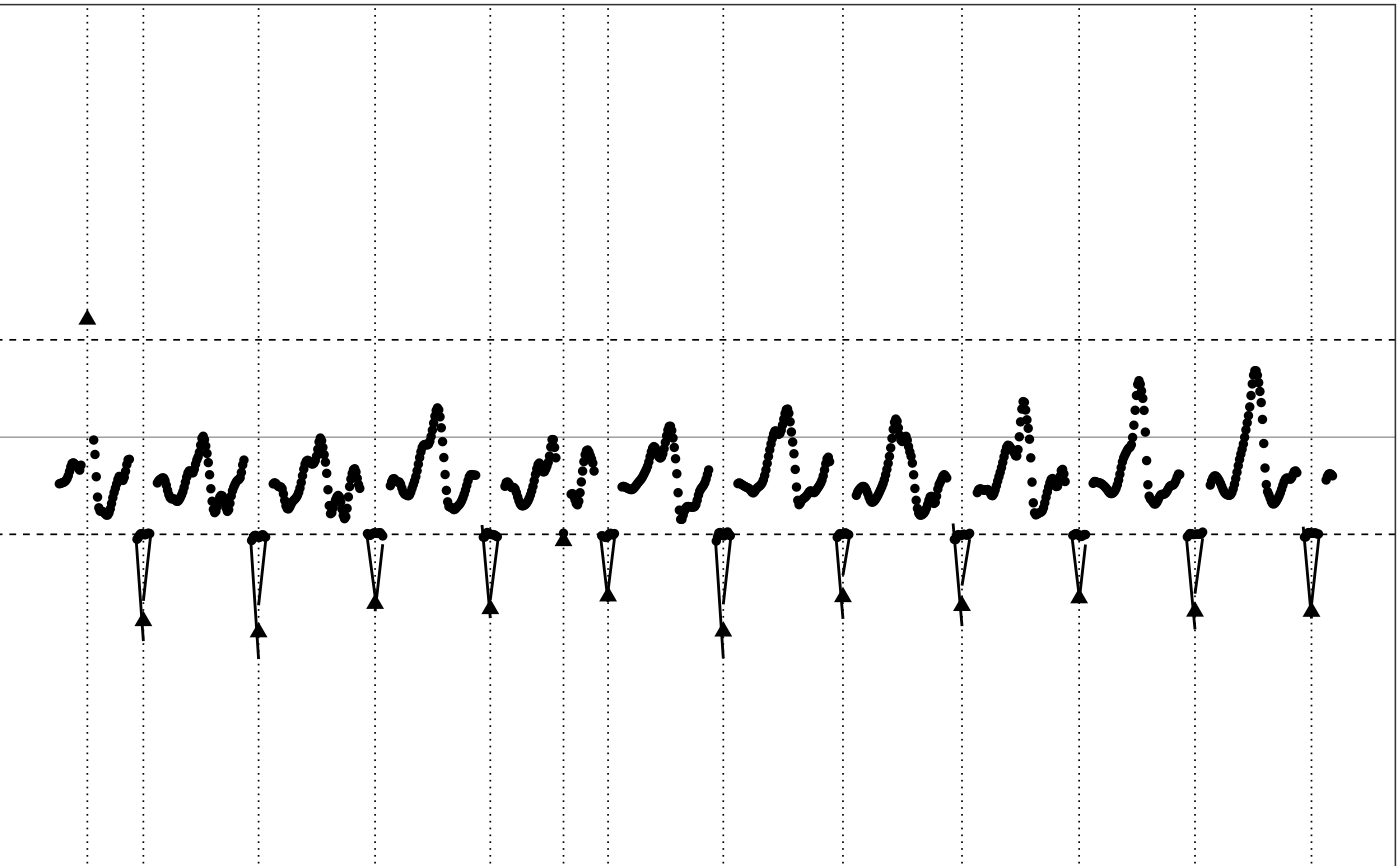
 # Do not show neighbor points
illustrate_extrapolation(df, dynamic_range=c(-2,2), show_neighbors=FALSE)
#> Warning: collapsing to unique 'x' values
#> Warning: A <numeric> value was passed to a Datetime scale.
#> ℹ The value was converted to a <POSIXct> object.
# Do not show neighbor points
illustrate_extrapolation(df, dynamic_range=c(-2,2), show_neighbors=FALSE)
#> Warning: collapsing to unique 'x' values
#> Warning: A <numeric> value was passed to a Datetime scale.
#> ℹ The value was converted to a <POSIXct> object.
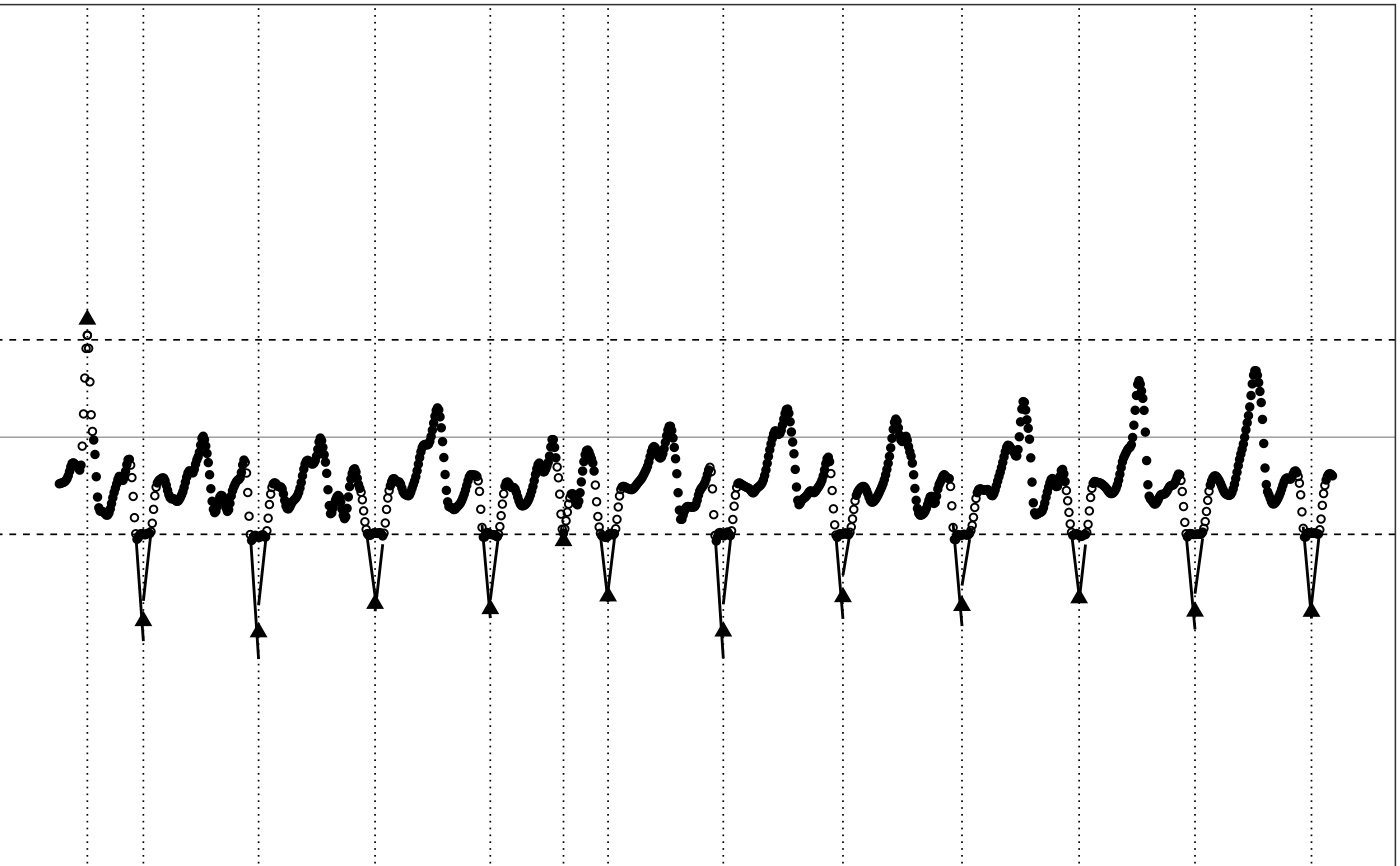
 # Do not show extrapolated points and lines
illustrate_extrapolation(df,
dynamic_range=c(-2,2),
show_extrapolated_points_and_lines=FALSE)
#> Warning: collapsing to unique 'x' values
# Do not show extrapolated points and lines
illustrate_extrapolation(df,
dynamic_range=c(-2,2),
show_extrapolated_points_and_lines=FALSE)
#> Warning: collapsing to unique 'x' values