iir function takes a multi-channel signal and applies an IIR filter to
the signal.
iir(df, sr, cutoff_freq, order = 4, type = "high", filter_type = "butter")Arguments
- df
dataframe. The input multi-channel signal. The first column is timestamps in POSXlct format. The rest columns are signal values.
- sr
number. Sampling rate in Hz of the input signal.
- cutoff_freq
number or numerical vector. The cutoff frequencies in Hz. If the IIR filter is a bandpass or bandstop filter, it will be a 2-element numerical vector specifying the low and high end cutoff frequencies
c(low, high).- order
number. The order of the filter. Default is 4.
- type
string. Filtering type, one of "low" for a low-pass filter, "high" for a high-pass filter, "stop" for a stop-band (band-reject) filter, or "pass" for a pass-band filter.
- filter_type
string. IIR filter type, one of "butter" for butterworth filter, "chebyI" for Chebyshev Type I filter, or "ellip" for Elliptic filter.
Value
dataframe. Filtered signal.
Details
This function filters the input multi-channel signal by applying an IIR
filter. See
wiki for the
explanation of the filter. The implementations of IIR filters can be found in
butter, cheby1, and ellip.
For Chebyshev Type I, Type II and Elliptic filter, the passband ripple is fixed to be 0.05 dB. For Elliptic filter, the stopband ripple is fixed to be -50dB.
How is it used in MIMS-unit algorithm?
This function has been used as the main filtering method in MIMS-unit algorithm. Specifically, it uses a 0.5 - 5 Hz bandpass butterworth filter during filtering.
See also
Other filtering functions:
bandlimited_interp()
Examples
  # Use sample data
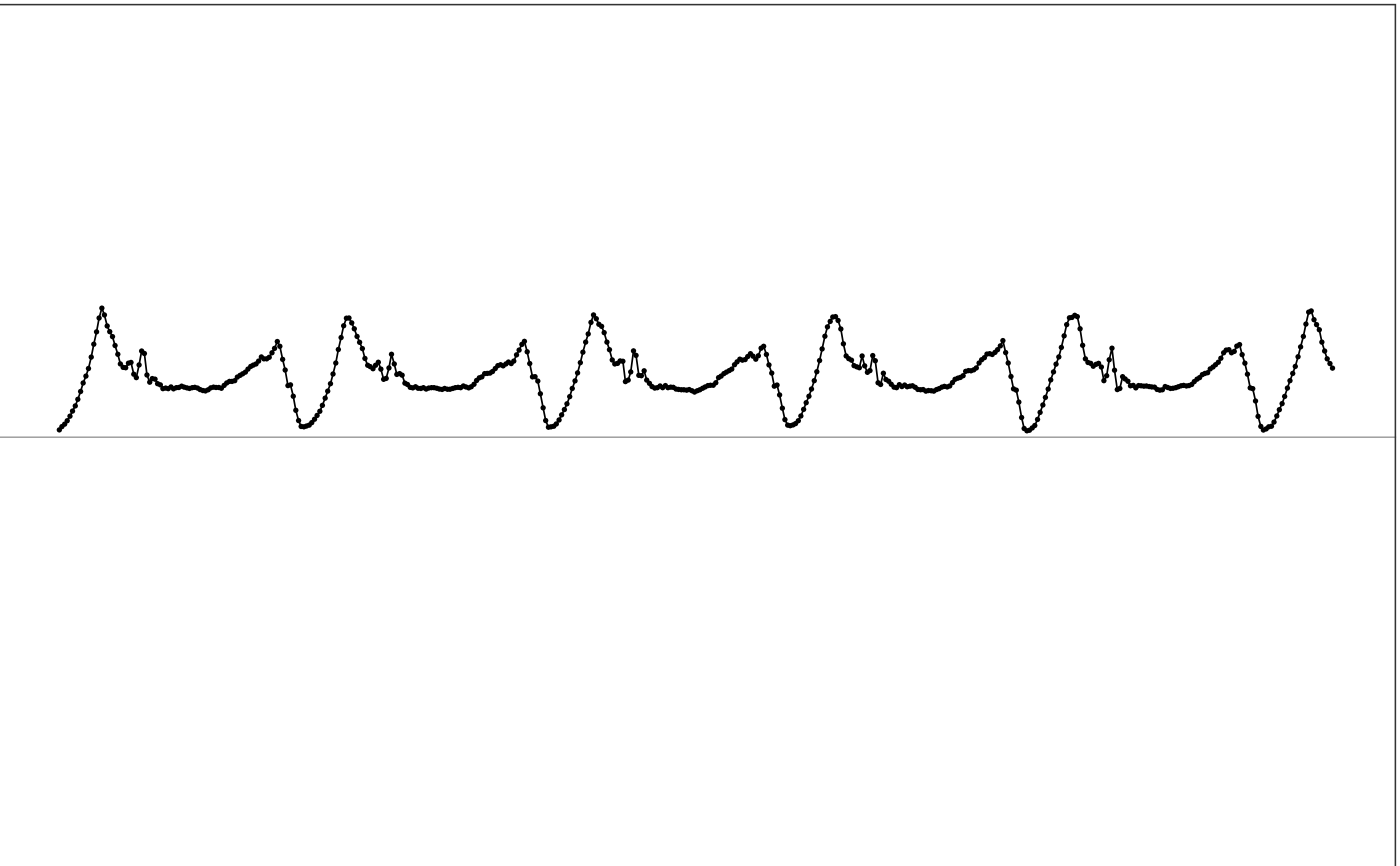
  df = sample_raw_accel_data

  # View input
  illustrate_signal(df, plot_maxed_out_line = FALSE)


  # Apply filtering that uses the same setting as in MIMSunit algorithm
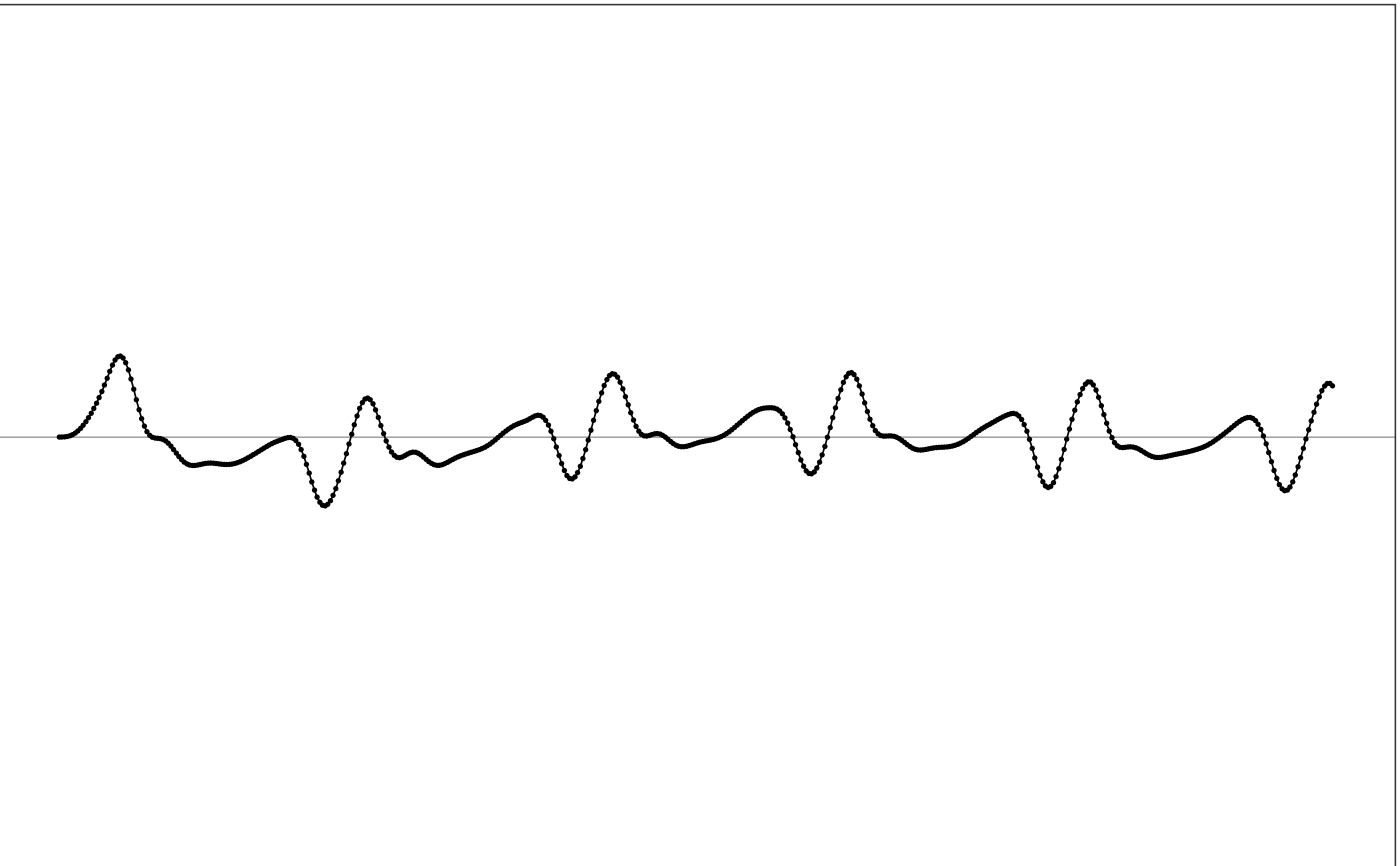
  output = iir(df, sr=80, cutoff_freq=c(0.2, 5), type='pass')

  # View output
  illustrate_signal(output, plot_maxed_out_line = FALSE)
